


By William Maley
Staff Writer - CheersandGears.com
April 22, 2013
AAA recently released their annual ‘Your Driving Costs’ study and finds that average American driver is now paying $9,122 per year to keep their vehicle on the road, an increase of 1.92% when compared to 2012. Assuming a person is driving around 15,000 miles a year, that breaks down 60.8 cents per mile.
The study looks at the costs of keeping a vehicle on road such as gas, maintenance, and insurance to name a few.
“Many factors go into the cost calculation of owning and operating a vehicle. This year, changes in maintenance, fuel and insurance costs resulted in the increase to just over 60 cents a mile,” said John Nielsen, AAA Director of Automotive Engineering and Repair.
Fuel, insurance, and depreciation were the biggest costs in the study, totaling $6,700 per year.
Source: AAA
William Maley is a staff writer for Cheers & Gears. He can be reached at [email protected]or you can follow him on twitter at @realmudmonster.
Press Release is on Page 2
Cost of Owning and Operating Vehicle in U.S. Increases Nearly Two Percent According to AAA’s 2013 ‘Your Driving Costs’ Study
-
Increase in maintenance, insurance and fuel drive up average cost for sedans to $9,122 yearly, 60.8 cents per mile
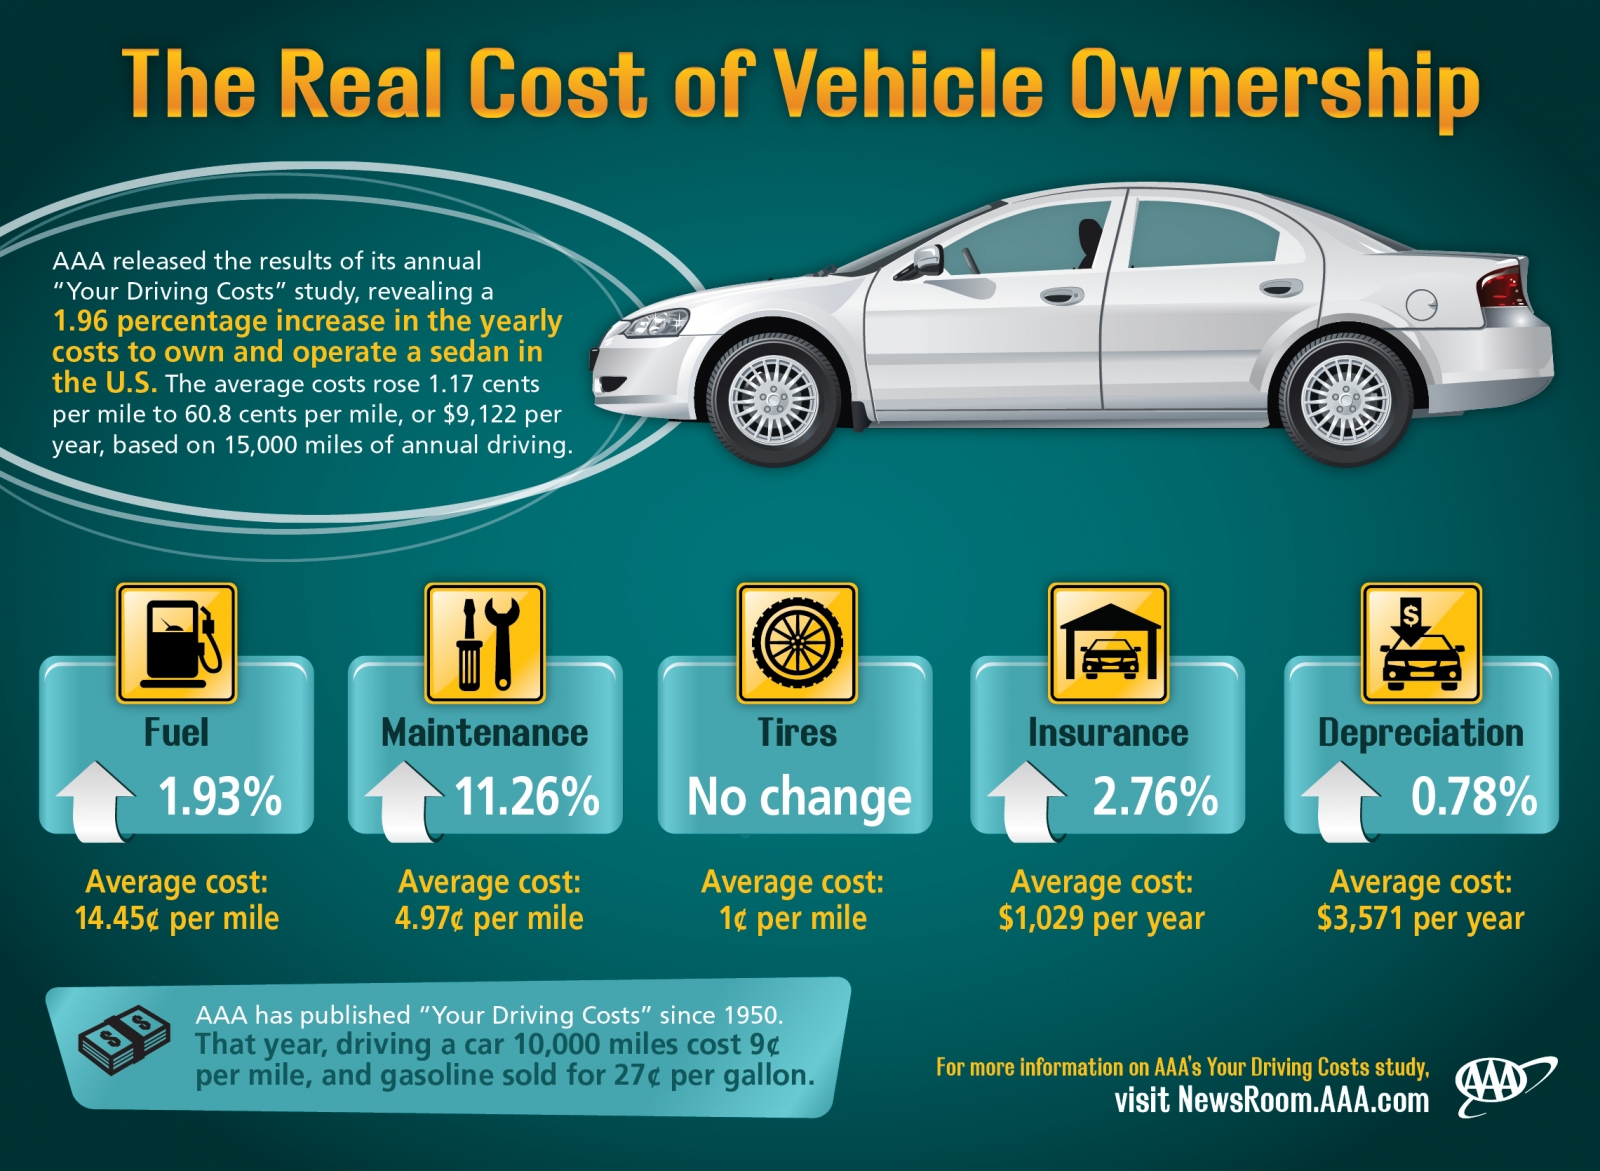
ORLANDO, Fla., (April 16, 2013) – AAA released the results of its annual ‘Your Driving Costs’ study today, revealing a 1.96 percent increase in the cost to own and operate a sedan in the U.S. The average cost rose 1.17 cents to 60.8 cents per mile, or $9,122 per year, based upon 15,000 miles of annual driving.
“Many factors go into the cost calculation of owning and operating a vehicle,” said John Nielsen, AAA Director of Automotive Engineering and Repair. “This year, changes in maintenance, fuel and insurance costs resulted in the increase to just over 60 cents a mile.”
The findings of the 2013 ‘Your Driving Costs’ study include:

In-depth findings of this year’s study, including a breakdown of specific costs by category of vehicle and various annual mileages, are contained in the ‘Your Driving Costs’ brochure which is available at select local AAA branch offices or may be downloaded in the additional resources bar.
Nielsen continued, “Before you make any vehicle purchase, it is important to determine ownership and operational costs and compare them to your current and future financial situation.” To assist consumers in determining their individual driving costs, the AAA ‘Your Driving Costs’ brochure contains a worksheet that can be filled out and personalized for a specific area, driver and vehicle.
Maintenance Costs Up 11.26 Percent
The costs associated with maintaining a vehicle had the single largest percentage increase from 2012 to 2013, growing by 11.26 percent to 4.97 cents per mile on average for sedan owners. AAA’s estimates are based upon the cost to maintain a vehicle and perform needed repairs for five years and 75,000 miles including labor expenses, replacement part prices and the purchase of an extended warranty policy. Driving the increase in maintenance costs is significant increases in labor and part costs for some models and a major increase in the price of extended warranty policies due to high loss ratios by underwriters.
Fuel Costs Up 1.93 Percent
Gasoline prices were relatively stable compared to the prior year, leading to a minimal fuel cost increase of 1.93 percent to 14.45 cents per mile on average for sedan owners. The average cost of regular grade fuel (used by most of the study vehicles) actually rose 3.84 percent, from $3.357 to $3.486 per gallon. However, several vehicles in the ‘Your Driving Costs’ study had small improvements in their fuel economy ratings which partially offset the fuel cost increase. Fuel costs in the 2013 study were calculated using the national average price for regular, unleaded gasoline during the fourth quarter of 2012.
Tire Costs Remain Unchanged
The cost of tires did not change from 2012 to 2013, remaining at one cent per mile on average for sedan owners. The stable price is attributed to a leveling off of past increased costs for raw materials, energy and transportation from factories to distributors across the country.
Insurance Costs Up 2.76 Percent
Average insurance costs for sedans rose 2.76 percent (or $28) to $1029 annually. Insurance rates vary widely by driver and driving record, issuing company and geographical region. AAA insurance cost estimates are based on a low-risk driver with a clean driving record. Quotes from five AAA clubs and insurance companies representing seven states showed across-the-board modest increases for all sedan sizes, with large cars having less of an increase than small- and medium-size sedans.
Depreciation Costs Rise .78 Percent
After seeing a drop in 2012, depreciation costs were up slightly in 2013, increasing .78 percent to $3,571 a year. This change may be a consequence of recovering new vehicle sales, resulting in more used cars available in the marketplace and thus the softening of the resale value of clean older models.
63rd Year of ‘Your Driving Costs’ Study
AAA has published ‘Your Driving Costs’ since 1950. That year, driving a car 10,000 miles per year cost 9 cents per mile, and gasoline sold for 27 cents per gallon.
The ‘Your Driving Costs’ study employs a proprietary AAA methodology to analyze the cost to own and operate a vehicle in the United States. Variable operating costs considered in the study include fuel, maintenance and repair, and tires. Fixed ownership costs factored into the results include insurance, license and registration fees, taxes, depreciation and finance charges. Ownership costs are calculated based on the purchase of a new vehicle that is driven over five years and 75,000 miles. Your actual operating costs may vary. See AAA’s 2013 ‘Your Driving Costs’ brochure for a list of vehicles and additional information on the underlying criteria used in the study.
Recommended Comments
Join the conversation
You can post now and register later. If you have an account, sign in now to post with your account.
Note: Your post will require moderator approval before it will be visible.